Research Blanket Square - Evidence-based Heart Rate Centile
Part of the ITFF Research Blanket Project
Susannah Fleming
Research Statement
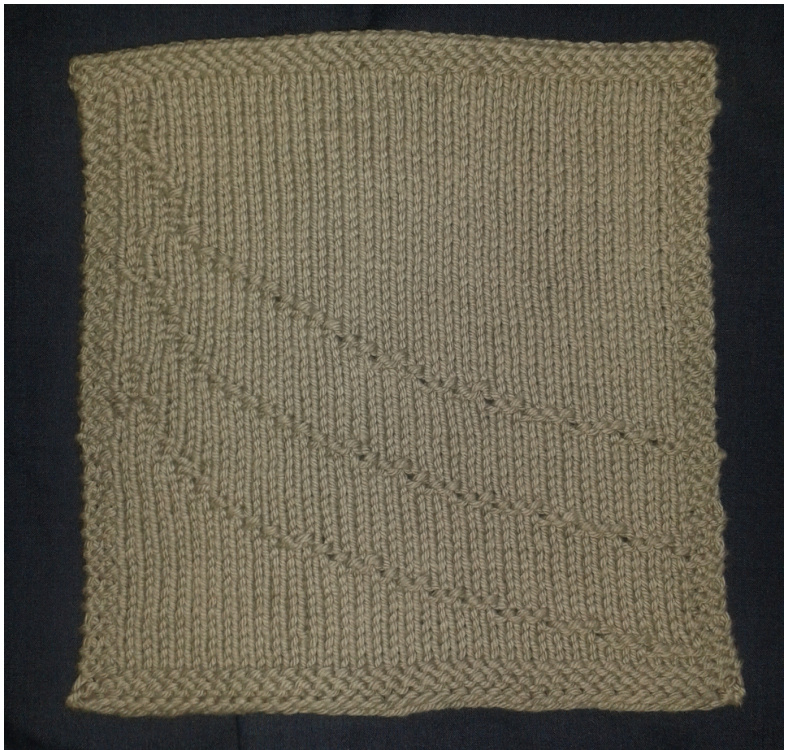
This block represents some of the results of the research I did as part of my doctorate. Heart rate and breathing rate are important "vital signs" in children, and are used to help diagnose serious illnesses such as meningitis, pneumonia, and sepsis. During childhood, the normal ranges of both heart rate and breathing rate change, so that what is normal for a baby may be dangerously high in an older child or teenager. The current standards for "normal" ranges of heart rate and breathing rate in children vary between countries, and have been developed by consensus between experts, rather than evidence, so we don't really know whether they reflect the“true"normal. Many researchers have measured normal heart rate and breathing rate in healthy children as part of research projects, and published their results. Using statistics, it is possible to combine this information to come up with a set of graphs, called centiles, showing how normal heart rate and breathing rate changes over childhood. We would expect about half of healthy children to be above the median (middle) centile, and half to be below it. We can also calculate other centiles to show how spread out heart rate and breathing rate is at different ages. For example, we would expect only 1 in 20 normal children to be above the 95th centile, and only 1 in 20 to be below the 5th centile. The 5th and 95th centiles are often used as the “limits" of normality, because we expect 90% (or 9 out of 10) normal people to be within these two lines. Children with heart rates or breathing rates outside these lines may be showing signs of illness, and may need further investigation to identify why their heart rate or breathing rate is unusually fast or slow. The research blanket square shows the median, 5th and 95th centile lines for heart rate from birth to 17 years of age. Each stitch across bottom row (the xaxis) represents 6 months of age. Each stitch up the side (the y-axis) represents 2 beats per minute. To fit the graphs onto the square, the heart rate does not start at zero at the bottom of the square, but starts at about 48 beats per minute at the bottom of the central square (excluding the garter stitch border). You can see from the square that heart rate increases from birth to a peak at 6 months of age, and then decreases quickly during the first few years of life, stabilising towards late adolescence as the body matures. A table showing the values charted in the square is shown below:
| Ages | 5th Centile | Median | 95th Centile |
| (yrs) 0.00 | 100.91 | 127.12 | 153.3 |
| 0.50 | 111.34 | 136.74 | 161.7 |
| 1.00 | 101.67 | 125.87 | 149.2 |
| 1.50 | 94.71 | 119.29 | 143.0 |
| 2.00 | 89.32 | 113.45 | 136.7 |
| 2.50 | 85.40 | 109.35 | 132.6 |
| 3.00 | 82.32 | 106.19 | 129.5 |
| 3.50 | 79.93 | 103.70 | 127.0 |
| 4.00 | 78.06 | 101.69 | 125.0 |
| 4.50 | 76.46 | 99.93 | 123.1 |
| 5.00 | 74.92 | 98.22 | 121.2 |
| 5.50 | 73.33 | 96.48 | 119.4 |
| 6.00 | 71.68 | 94.72 | 117.5 |
| 6.50 | 70.03 | 92.99 | 115.7 |
| 7.00 | 68.47 | 91.34 | 114.0 |
| 7.50 | 67.05 | 89.80 | 112.4 |
| 8.00 | 65.75 | 88.38 | 110.8 |
| 8.50 | 64.57 | 87.06 | 109.4 |
| 9.00 | 63.47 | 85.84 | 108.1 |
| 9.50 | 62.44 | 84.70 | 106.8 |
| 10.00 | 61.48 | 83.63 | 105.7 |
| 10.50 | 60.57 | 82.64 | 104.6 |
| 11.00 | 59.71 | 81.70 | 103.6 |
| 11.50 | 58.90 | 80.81 | 102.7 |
| 12.00 | 58.13 | 79.97 | 101.8 |
| 12.50 | 57.39 | 79.16 | 100.9 |
| 13.00 | 56.67 | 78.39 | 100.1 |
| 13.50 | 55.96 | 77.63 | 99.3 |
| 14.00 | 55.27 | 76.89 | 98.5 |
| 14.50 | 54.59 | 76.16 | 97.8 |
| 15.00 | 53.91 | 75.44 | 97.0 |
| 15.50 | 53.25 | 74.74 | 96.3 |
| 16.00 | 52.60 | 74.05 | 95.6 |
| 16.50 | 51.97 | 73.38 | 94.9 |
| 17.00 | 51.36 | 72.73 | 94.2 |
| 17.50 | 50.76 | 72.10 | 93.5 |
| 18.00 | 50.17 | 71.48 | 92.9 |
Reference:
Fleming S, Thompson M, Stevens R, et al. Normal ranges of heart rate and respiratory rate in children from birth to 18 years of age: a systematic review of observational studies. The Lancet 2011; 377 (9770): 1011-18. doi:10.1016/S0140-6736(10)62226-X (als0 dep0sited in Europe PMCwithPMCIDPMC3789232)
Pattern
Gauge: approx. 20 sts / 32 rows = 4" in stocking stitch Finished measurements: 8" square Materials: Approx 60m / 65yds DK yarn 1 set straight 3.25mm needles (or size required to obtain gauge) Tapestry needle Directions: Cast on 41 stitches. Follow the chart on the next page. The square starts and ends with 4 rows of garter stitch, and has a 3-stitch garter stitch border along each edge. These help to keep the square flat. You may wish to slip the first stitch of every row to provide a more firm edging to allow the square to be joined to other squares to form a blanket. The chart reads from bottom to top. On odd (right side) rows, read the chart from right to left, and knit blank squares and purl dashed squares. On even (wrong side) rows, read the chart from left to right, and purl blank squares and knit dashed squares. This results in a stockinette background with the graph reproduced in purl stitches on the right side. When you have completed the chart, cast off and weave in ends. Block the square to the finished dimensions.
| 68.0 67.0 66.0 65.0 64.0 63.0 62.0 162.0 61.0 160.0 60.0 59.0 58.0 57.0 56.0 33.0 32.0 31.0 30.0 8 29.0 28.0 27.0 92.0 26.0 90.0 25.0 88.0 24.0 86.0 23.0 22.0 21.0 20.0 788 19.0 18.0 74.0 17.0 72.0 16.0 15.0 14.0 66.0 13.0 64.0 12.0 62.0 11.0 60.0 10.0 9.0 8.0 7.0 6.0 50.0 5.0 4.0 3.0 2.0 1.0 | ||||||||||||||||||||||||||||||||||||||||
| x | xxx x | xxx xxx | xxxx | xxx | xxx xxx | xxx | xxx | xxx xxx | xxx | xxx | xxxx | xxxx | xxxx | xxx | xx× | xxx xxx | xxx xxx | xxxx xxxx | xxx | xxx | xxx xxx | xxx | xxx | xxx | xxxxxxxxxxxxxxxxxxxxxxxxxxxxxxxxxxxxxxxxxxxxxxxxxxxxxxxxxxxxxxxxxxx | |||||||||||||||
| x x | xxx | xxx | xxxx | x | xxx | |||||||||||||||||||||||||||||||||||
| x | x x | x | x | x | x x | x | x x | x | x | x x | x | x | x | x | x | x | x | x | x | |||||||||||||||||||||
| 158.0 156.0 x | ||||||||||||||||||||||||||||||||||||||||
| 154.0 152.0 150.0 xx | ||||||||||||||||||||||||||||||||||||||||
| 55.0 148.0 54.0 146.0 53.0 144.0 52.0 142.0 140.0 | xxxxxxxxxxxxxxxxxxxxxxxxxxxxxxxxxxxxxxxxxxxxxxxxxxxxxxxxxxxxxxxxxxxx | |||||||||||||||||||||||||||||||||||||||
| 51.0 50.0 138.0 49.0 48.0 47.0 46.0 | ||||||||||||||||||||||||||||||||||||||||
| 136.0 45.0 | xxxxxxxxxxxxxxxxxxxxxxxxxxxxxxxxxxxxxxxxxxxxxxxxxxxxxxxxxxxxxxxxxxxx | |||||||||||||||||||||||||||||||||||||||
| 128 44.0 43.0 42.0 | ||||||||||||||||||||||||||||||||||||||||
| 118.0 | xxxxxxxxxxxxxxxxxxxxxxxxxxxxxxxxxxxxxxxxxxxxxxxxxxxxxxxxxxxxxxxxxxxx | |||||||||||||||||||||||||||||||||||||||
| 41.0 40.0 39.0 116.0 38.0 114.0 37.0 36.0 35.0 34.0 | xxxxxxxxxxxxxxxxxxxxxxxxxxxxxxxxxxxxxxxxxxxxxxxxxxxxxxxx x x x X x x × x x x x x X x X x x x x x x x x x x x x x x x x x x | X | X X x x x x | x x X | X X X x | x x X x | X x x | X x x | x x x X x X x X | x X x x | x x x | x x x x | x X X x x x x | x x x | x x x x | x x + x | x x x x | x x x | x x x X | X X x x | x x x X | X x x x X x x x | x x | x | x + x x |
.0 2.53.03.54.04.55.05.56.06.57.07.58.08.59.09.5 10.0 10.5 11.0 11.5 12.0 12.5 13.0 13.5 14.0 14.5 15.0 15.5 16.0 16.5 .0 9.0 10.0 11.0 12.0 13.0 14.0 15.0 16.0 17.0 18.0 19.0 20.0 21.0 22.0 23.0 24.0 25.0 26.0 27.0 28.0 29.0 30.0 31.0 32.0 33.0 34.0 35.0 36.0 37.0 38.0 39.0 40.0 41.1


